A review of third quarter reports from hedge funds finds that, at least as of September 30, many event-driven managers continue to seek much of their equity-like exposure through positions in distressed or discounted but still performing credits. The extent to which this is a deliberate choice based on strategic considerations is not in all cases clear.
Strategies of seeking equity-like exposure through the credit markets has had much to recommend them over the last couple of years, and dedicated investors in distressed situations are likely to continue to seek such exposure. But returns on these investments tend to be slow to develop and “lumpy.” It could be that, in many cases, the continued predominance of credits in event-driven portfolios simply reflects the fact that investments made a year or two ago have yet to achieve their return targets. Retention of a bias toward credits could also be a matter of liquidity: even at the best of times, most such instruments are fairly illiquid, and if the prospect that they will achieve their return targets are fading, demand for them is likely to be even less. Managers who might otherwise allocate away from them may be deterred by the necessity of having to accept steep discounts in order to liquidate them.
Distress and discounted performing credits are always with us, but their supply varies, as does their inherent attractiveness. The opportunity to acquire the paper of sound borrowers at steep discounts occurs only during times of crisis – the credit spreads on such paper have narrowed since the Credit Crunch, and where liquidity allowed, most such positions acquired at that time have probably been realized. There is always new supply of distressed debt, as previously healthy firms encounter difficulty, but the quality of a borrower that enters into distress at a time of relative economic calm is rather different from that of a borrower whose distress results from global macroeconomic dislocation. Widespread distress offers opportunity to hedge funds that are not distressed debt specialists. As the new supply of distressed debt arises increasingly from firms that fall into distress for idiosyncratic, firm-specific rather than macroeconomic reasons, fewer managers other than distressed debt specialists will be attracted to it.
All this suggests that many hedge funds’ allocation toward credits will decrease over time, almost certainly in favor of an increased allocation to equities. The credit positions they have built over the last few years will either attain their return targets and be liquidated or gradually be abandoned. Specialists will continue to plough the debt furrow, but the majority of event-driven managers are likely to find more opportunity in trades employing equities rather than equity-surrogates. Other factors support this trend – most notably the high levels of liquidity on corporate balance sheets. This encourages corporations to create opportunities for merger arbitrage, a tendency that is already clearly in place, and in an environment where arbitrageurs face less competition from private market buyers than they have in the recent past. Where they are not used to finance acquisitions, cash hoards invite corporate activism, in which many event-driven managers delight. The U.S. environment for activism will improve next year, thanks to changes to proxy rules. In the next year or so, strategies involving equities can be expected to bulk larger in event-driven portfolios than they have recently.
Tuesday, November 9, 2010


Monday, October 11, 2010
Life Settlements Returning to Life?
The Wall Street Journal reported on October 9 that Leon Black’s Apollo Global Management is raising a $525 million fund to invest in life settlements, and the Financial Times notes that similar funds are being marketed in Europe. According to an SEC staff report, this rather obscure investment category has seen investor interest halve since its 2008 peak, when $15 billion in face value was transacted, but these high-profile fund raisings suggest that it may be reviving.
Investors in life settlements buy an actuarially diversified pool of life insurance policies from their owners. Payment for them is above surrender value but at a negotiated discount to face value, which is currently around 87%. Purchasers pay the policy premia (5 - 10% of face value per year) until the demise of the insured, at which point they claim the policies’ face value from the insurers that issued them.
Apart from the returns it can offer, the principal attraction of this type of investment is that it has little correlation to any other: it provides an income stream that is unrelated to security market trends, and since it is self-liquidating, exit involves uncertainty only as to timing and not as to the price that will be achieved. For example, a single policy purchased at 13% of face value with a 5% annual premium will return a compound annual rate of 17.5% if the insured expires after seven years. Obviously, the rate of return is strongly influenced by actual mortality outcomes: in this example, the return would be 23.4% if death occurs in six years and 13.3% if it occurs in eight. Thus the principal risk involved in life settlements relates to the soundness of the actuarial assumptions underlying the construction of the basket of policies purchased. If properly constructed, the same assumptions imply that later premia can be covered by earlier mortalities, making the position self-financing after a few years.
There are various reasons why life settlements have never attracted enormous investor interest and have recently fallen further out of favor. Not least are controversy and complex litigation surrounding policy acquisition practices, many of which have been questionable in the past. The industry has established codes of conduct, most states have legislated on these matters, and one of the recommendations of the SEC staff paper mentioned above was that life settlements should be brought within the definition of ‘security,’ which would allow federal regulation by the SEC. Thus uncertainty regarding investors’ title to policies should be in the process of resolution. However, this will not address issues regarding the return structure of these investments.
Consider the highly simplified caricature of a life settlement fund in the chart below. It consists of 500 policies with a face value of $1 million each, on the lives of average American males who simultaneously turned age 75 at the start of year one. Mortality assumptions are drawn from the Social Security Administration’s Period Life Table for 2006. The policies are purchased at an 87% discount to face value and each has a $50,000 annual premium. To keep matters simple, premium payments, receipt of death benefits accumulated over the course of the year and income distributions all occur on the last day of each year.

The compound annual return on this hypothetical investment is a very respectable 12.4% over thirty years. However, it is rather slow in coming: cumulative return is negative, dipping as low as -6.8% at the end of year two, and first turns positive at the end of year five. Premium payments due exceed death benefits received by $4.4 million in the first two years, so the first distribution is received at the end of year three. The investment does not return the initial $65 million investment until year eleven. In short, life settlements exhibit a fairly extreme J-curve, which is bound to limit investor interest in them to those with long investment horizons and the patience to wait for the first glimmer of a return. While this makes them sound ideal for many institutional purposes, it is an unusual (if exemplary) investment committee that can tolerate negative returns for five years and still have achieved only a 9.2% compound return after ten.
Of course, this example is contrived: real funds have much greater actuarial diversity. If the basket of policies includes some on older people or viatical settlements – that is, policies on people with a life expectancy of less than two years (the 75-year olds in the example have an average life expectancy of 10.5 years at time zero) – the investment’s unproductive period can be reduced. However, the J-curve cannot be completely eliminated. Regardless of the construction of the policy basket, life settlements will remain suitable only to patient investors.
So the audience for the funds being launched is rather limited, and it is unlikely that many such vehicles will be offered successfully. This is unfortunate, because many of the policies in the new crop of funds will be purchased from banks that need the liquidity. While there has been some discussion of securitization of life settlements (another reason for the SEC’s interest), most industry commentators seem to think that this is an unlikely development. Again, the return profile explains why. This also is unfortunate: despite the whiff of sulfur around an investment activity that appears to gamble on peoples’ deaths, and which has sometimes been characterized by dubious practices in the past, a more economic alternative to surrendering their policies is a very real benefit to some of the insured. While the life settlement market is unlikely ever to become big, it is not a bad thing that there is at least some life in it yet.
Investors in life settlements buy an actuarially diversified pool of life insurance policies from their owners. Payment for them is above surrender value but at a negotiated discount to face value, which is currently around 87%. Purchasers pay the policy premia (5 - 10% of face value per year) until the demise of the insured, at which point they claim the policies’ face value from the insurers that issued them.
Apart from the returns it can offer, the principal attraction of this type of investment is that it has little correlation to any other: it provides an income stream that is unrelated to security market trends, and since it is self-liquidating, exit involves uncertainty only as to timing and not as to the price that will be achieved. For example, a single policy purchased at 13% of face value with a 5% annual premium will return a compound annual rate of 17.5% if the insured expires after seven years. Obviously, the rate of return is strongly influenced by actual mortality outcomes: in this example, the return would be 23.4% if death occurs in six years and 13.3% if it occurs in eight. Thus the principal risk involved in life settlements relates to the soundness of the actuarial assumptions underlying the construction of the basket of policies purchased. If properly constructed, the same assumptions imply that later premia can be covered by earlier mortalities, making the position self-financing after a few years.
There are various reasons why life settlements have never attracted enormous investor interest and have recently fallen further out of favor. Not least are controversy and complex litigation surrounding policy acquisition practices, many of which have been questionable in the past. The industry has established codes of conduct, most states have legislated on these matters, and one of the recommendations of the SEC staff paper mentioned above was that life settlements should be brought within the definition of ‘security,’ which would allow federal regulation by the SEC. Thus uncertainty regarding investors’ title to policies should be in the process of resolution. However, this will not address issues regarding the return structure of these investments.
Consider the highly simplified caricature of a life settlement fund in the chart below. It consists of 500 policies with a face value of $1 million each, on the lives of average American males who simultaneously turned age 75 at the start of year one. Mortality assumptions are drawn from the Social Security Administration’s Period Life Table for 2006. The policies are purchased at an 87% discount to face value and each has a $50,000 annual premium. To keep matters simple, premium payments, receipt of death benefits accumulated over the course of the year and income distributions all occur on the last day of each year.

The compound annual return on this hypothetical investment is a very respectable 12.4% over thirty years. However, it is rather slow in coming: cumulative return is negative, dipping as low as -6.8% at the end of year two, and first turns positive at the end of year five. Premium payments due exceed death benefits received by $4.4 million in the first two years, so the first distribution is received at the end of year three. The investment does not return the initial $65 million investment until year eleven. In short, life settlements exhibit a fairly extreme J-curve, which is bound to limit investor interest in them to those with long investment horizons and the patience to wait for the first glimmer of a return. While this makes them sound ideal for many institutional purposes, it is an unusual (if exemplary) investment committee that can tolerate negative returns for five years and still have achieved only a 9.2% compound return after ten.
Of course, this example is contrived: real funds have much greater actuarial diversity. If the basket of policies includes some on older people or viatical settlements – that is, policies on people with a life expectancy of less than two years (the 75-year olds in the example have an average life expectancy of 10.5 years at time zero) – the investment’s unproductive period can be reduced. However, the J-curve cannot be completely eliminated. Regardless of the construction of the policy basket, life settlements will remain suitable only to patient investors.
So the audience for the funds being launched is rather limited, and it is unlikely that many such vehicles will be offered successfully. This is unfortunate, because many of the policies in the new crop of funds will be purchased from banks that need the liquidity. While there has been some discussion of securitization of life settlements (another reason for the SEC’s interest), most industry commentators seem to think that this is an unlikely development. Again, the return profile explains why. This also is unfortunate: despite the whiff of sulfur around an investment activity that appears to gamble on peoples’ deaths, and which has sometimes been characterized by dubious practices in the past, a more economic alternative to surrendering their policies is a very real benefit to some of the insured. While the life settlement market is unlikely ever to become big, it is not a bad thing that there is at least some life in it yet.
Wednesday, September 29, 2010
Correlation Trading
Members of the option community have for some years touted implied volatility as the “new asset class,” so it was probably inevitable that their creative energies would turn to implied correlation as the “new, new asset class.” Volatility is relatively easy to trade, using options straddles, for example, and the CBOE’s 2003 launch of the “new” VIX Index and related derivatives, which are essentially just synthetic straddles, simply offered convenience rather than a revolutionary new opportunity to traders. Structuring option positions that provide directional exposure to correlation is more difficult, and such trades were uncommon among any but the most sophisticated option arbitrageurs until the designers at the CBOE launched the S&P 500 Implied Correlation Index last year.
The Index is a synthetic dispersion trade. In a structure that is bullish on correlation, long positions in call options on a basket of index components are hedged with short positions in calls on the index. A bearish view on correlation would reverse the long and short positions. It is essential that the basket of long calls be optimized to replicate the trading behavior of the index as closely as possible – the CBOE Index employs fifty positions, rebalanced monthly – which explains why relatively few traders exploited this structure in the past. The way the structure works is that the index position hedges away the β of the individual components, so that what remains is their specific risk. When this decreases relative to their β, correlation increases; when it increases relative to their β, correlation declines.
Predictably, correlation counter-correlates with the underlying S&P 500 Index, but not nearly as much as volatility does: the coefficient of correlation was -0.4075 for the January 2011 Correlation Index (11/25/08 - 9/27/10; ticker JCJ) compared to -0.7280 for the VIX Index. Also as would be expected, correlation was considerably less volatile than the VIX during the same period (annualized standard deviations of 47.9% and 110.9%, respectively), although it is somewhat surprising that correlation had nearly twice the 26.5% volatility exhibited by the underlying S&P 500 Index.
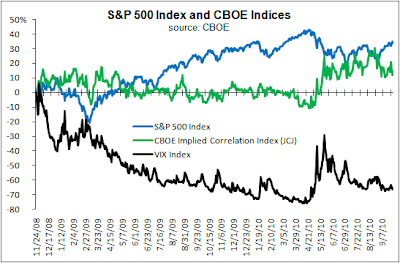
As with the VIX Index, it is important to remember that the Correlation Index is an option-implied statistic, and that its value as a predictor of actual outcomes is limited. Both tend to imply outcomes that are higher than they actually turn out to be, although they may on occasion undershoot the actual outcome, as they both have done recently. An article by Theo Casey in Futures and Options Intelligence (requires registration) argues that the current high levels of correlation can be ascribed to ETF trading, and there may be some merit in this. However, he also raises the possibility that this heralds a fundamental change in the structure of the equity markets. However, the high levels of activity in ETFs are themselves a result of current market conditions, and likely to change. Over its 23 month life, JCJ has traded as low as 19.92 and as high as 81.09. It does not seem likely that it is the bellwether of a consistently highly correlated market.
The Index is a synthetic dispersion trade. In a structure that is bullish on correlation, long positions in call options on a basket of index components are hedged with short positions in calls on the index. A bearish view on correlation would reverse the long and short positions. It is essential that the basket of long calls be optimized to replicate the trading behavior of the index as closely as possible – the CBOE Index employs fifty positions, rebalanced monthly – which explains why relatively few traders exploited this structure in the past. The way the structure works is that the index position hedges away the β of the individual components, so that what remains is their specific risk. When this decreases relative to their β, correlation increases; when it increases relative to their β, correlation declines.
Predictably, correlation counter-correlates with the underlying S&P 500 Index, but not nearly as much as volatility does: the coefficient of correlation was -0.4075 for the January 2011 Correlation Index (11/25/08 - 9/27/10; ticker JCJ) compared to -0.7280 for the VIX Index. Also as would be expected, correlation was considerably less volatile than the VIX during the same period (annualized standard deviations of 47.9% and 110.9%, respectively), although it is somewhat surprising that correlation had nearly twice the 26.5% volatility exhibited by the underlying S&P 500 Index.

As with the VIX Index, it is important to remember that the Correlation Index is an option-implied statistic, and that its value as a predictor of actual outcomes is limited. Both tend to imply outcomes that are higher than they actually turn out to be, although they may on occasion undershoot the actual outcome, as they both have done recently. An article by Theo Casey in Futures and Options Intelligence (requires registration) argues that the current high levels of correlation can be ascribed to ETF trading, and there may be some merit in this. However, he also raises the possibility that this heralds a fundamental change in the structure of the equity markets. However, the high levels of activity in ETFs are themselves a result of current market conditions, and likely to change. Over its 23 month life, JCJ has traded as low as 19.92 and as high as 81.09. It does not seem likely that it is the bellwether of a consistently highly correlated market.
Subscribe to:
Posts (Atom)