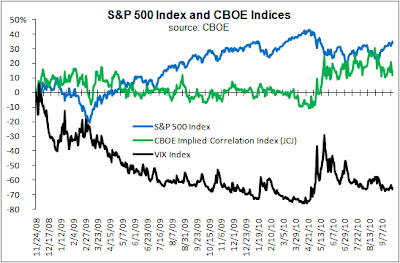
Members of the option community have for some years touted implied volatility as the “new asset class,” so it was probably inevitable that their creative energies would turn to implied correlation as the “new, new asset class.” Volatility is relatively easy to trade, using options straddles, for example, and the CBOE’s 2003 launch of the “new” VIX Index and related derivatives, which are essentially just synthetic straddles, simply offered convenience rather than a revolutionary new opportunity to traders. Structuring option positions that provide directional exposure to correlation is more difficult, and such trades were uncommon among any but the most sophisticated option arbitrageurs until the designers at the CBOE launched the S&P 500 Implied Correlation Index last year.
The Index is a synthetic dispersion trade. In a structure that is bullish on correlation, long positions in call options on a basket of index components are hedged with short positions in calls on the index. A bearish view on correlation would reverse the long and short positions. It is essential that the basket of long calls be optimized to replicate the trading behavior of the index as closely as possible – the CBOE Index employs fifty positions, rebalanced monthly – which explains why relatively few traders exploited this structure in the past. The way the structure works is that the index position hedges away the β of the individual components, so that what remains is their specific risk. When this decreases relative to their β, correlation increases; when it increases relative to their β, correlation declines.
Predictably, correlation counter-correlates with the underlying S&P 500 Index, but not nearly as much as volatility does: the coefficient of correlation was -0.4075 for the January 2011 Correlation Index (11/25/08 - 9/27/10; ticker JCJ) compared to -0.7280 for the VIX Index. Also as would be expected, correlation was considerably less volatile than the VIX during the same period (annualized standard deviations of 47.9% and 110.9%, respectively), although it is somewhat surprising that correlation had nearly twice the 26.5% volatility exhibited by the underlying S&P 500 Index.
As with the VIX Index, it is important to remember that the Correlation Index is an option-implied statistic, and that its value as a predictor of actual outcomes is limited. Both tend to imply outcomes that are higher than they actually turn out to be, although they may on occasion undershoot the actual outcome, as they both have done recently. An article by Theo Casey in Futures and Options Intelligence (requires registration) argues that the current high levels of correlation can be ascribed to ETF trading, and there may be some merit in this. However, he also raises the possibility that this heralds a fundamental change in the structure of the equity markets. However, the high levels of activity in ETFs are themselves a result of current market conditions, and likely to change. Over its 23 month life, JCJ has traded as low as 19.92 and as high as 81.09. It does not seem likely that it is the bellwether of a consistently highly correlated market.

No comments:
Post a Comment